Gregory Stockton
President
Stockton Infrared Thermographic Services, Inc. & United Infrared, Inc.
8472 Adams Farm RoadRandleman, NC 27317
Ph: 888-SCAN-4-IRwww.unitedinfrared.com
Abstract
Information technology (IT) managers are worrying more about heat in their data centers every day. The reliable and efficient operation of the power, cooling and support systems are vital to the continuous flow of information in these mission critical facilities. Getting as close to 100% uptime or “availability” at data center facilities is a necessity, as a loss in power in a data center can cost the owner millions of dollars. Now, owing to the ever-increasing cost of electricity and grid capacity issues, data center operators are now exploring the idea of raising the temperature set-points from 70 degrees F to 80 degrees F. This is no small market…it is estimated that data centers will consume 100 billion kWh of electricity by the end of this year. This paper will explore the traditional P/PM use of IR and the merits of thermally mapping the data center to validate CFD modeling used in the design phase, and so that problems to the cooling system can be found and documented and confirmed after repairs.
Introduction
Information Technology (IT) managers are worried about the heat in their data centers now, more than ever before and Infrared Thermography (IRt) is the perfect a tool to help them. The reliable and efficient operation of the power, cooling and support systems in data centers is vital to the continuous flow of information in these mission critical facilities. Failures happen as a result of overheating components, and a usable ‘heat view’ and expert analysis provides the answers they need. Hard failures at the data center costs businesses millions of dollars in lost productivity and opportunity costs.
Owing to the ever-increasing cost of electricity, grid capacity issues and ‘green thinking’ management, data center operators are now exploring the idea of raising the temperature set-points from an average 70 degrees F to 80 degrees F1. Because of the need for high uptime rates and higher server densities, data center operators want to optimize performance and increase the kW per square foot rating – all while reducing costs. Reducing the consumption of energy in a data center while maintaining high availability is no small task, but the rewards are high. In the US, servers and data centers consumed 61 billion kWh (1.5% of total US electrical consumption) in 2006 and are projected to consume as much as 100 billion kWh by the end of this year. Therefore, heat is no small issue for the owners and operators of data centers, or for infrared thermographers.
To ensure reliability and economical operating costs, the power distribution and cooling infrastructure must be actively managed. Because temperature is directly linked to energy consumption and equipment operation, infrared thermography (thermal imaging and thermal mapping) can be used to monitor power consumption, cooling, and IT operations. Infrared thermography is used to find, diagnose and document problems such as short-cycling of the air conditioning system, loose electrical connections and worn out bearings. After repairs have been made, IRt is used to recheck the equipment to make sure it is operating properly.
Outages stemming from electrical or mechanical failure can be prevented by physical redundancy practices and predictive/preventive maintenance (P/PM) practices, and are currently being used by most data centers, but the cooling distribution systems are much more complicated to monitor. Thermal Mapping is a new approach to gather and present data. Thermal mapping allows IT management, heating, ventilation and air conditioning (HVAC) professionals, consultants and contractors a construct to understand heat-related problems in the data center’s computer room. Thermal mapping also makes it possible to compare CFD models used to design the cooling system to the actual distribution of heat and cool. Because the complete picture is captured in-situ, issues that were not obvious when the room and cooling system were designed become apparent
A Little History
Traditionally, infrared thermography has been used to find, document, and diagnose problems on electrical power distribution systems and mechanical equipment. Our company has performed infrared surveys of data centers’ electrical and mechanical systems for over twenty years. Infrared predictive maintenance is a must at any data center. Performing infrared P/PM on electrical and mechanical equipment is crucial to continuous operation and is well accepted in the industry as standard best practice. In fact, electrical IR has been the most accepted of all IR applications and there are many technical papers available on the subject. The electrical switchgear, motors and motor controls, HVAC equipment, uninterruptible power supplies (UPS), automatic transfer switches (ATS), power distribution units (PDU), batteries and generator equipment and all electrical devices that feed the server systems must be checked with infrared thermography and other testing on a regular basis to assure super-high reliability rates (see Table 1).

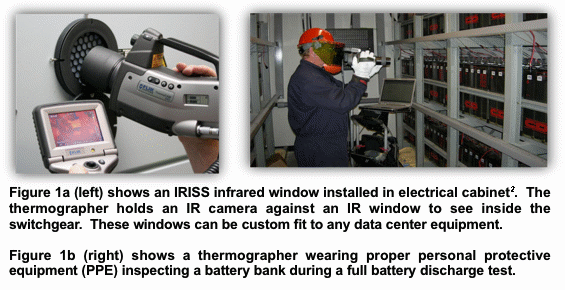
Documentation is very important and there must be total accountability of all survey results. So, a data log of all equipment surveyed must be created including a time/date stamp reference for each piece of equipment. This can be accomplished by recording the entire survey on digital videotape and/or capturing fully-radiometric IR images of all equipment, whether problems exist or not. Safety is of the utmost importance during any infrared survey of electrical and mechanical gear and the same applies in data centers (see Figures 1a & 1b).
“Looking Down the Asiles” vs Thermal Mapping
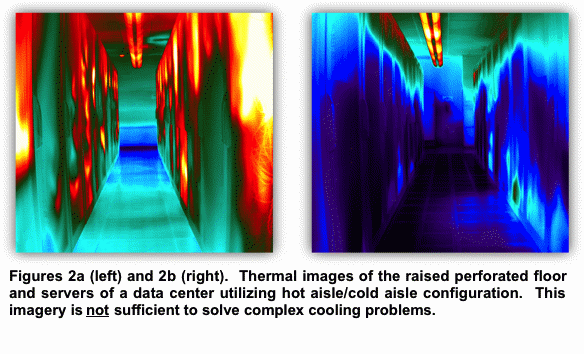
On various occasions over the years and mostly in the past 8 years, our clients started asking us to look at the cooling of the floors and server racks in the computer rooms to solve perceived and/or real cooling issues. A few years ago and with more and more requests for this service, we decided that a better method than single shots and “looking down the aisles” imagery (see Figures 2a & 2b) needed to be developed, tested and implemented.
To look at the cooling of the floors and the distribution of cooled air to the servers through the floors, we needed to get a picture of the heat distribution in the entire data center, as if someone were to rip off the roof and let us look straight down. In many data centers the ceilings are only a few feet higher than the panels so we knew our field of view was going to be relatively narrow. We were also going to need a camera system (infrared and visual) to take many images and save them in an organized manner.
Finally, we needed also develop a software program with algorithms that could efficiently stitch thousands of images together into user-friendly 2-D (2-dimensional) and 3-D (3-dimensional) thermal map displays.
Cooling Systems in Data Centers
Traditionally, data centers have been air-cooled. Still today, the typical data center is air-cooled, utilizing the hot aisle/cold aisle layout (see Figure 3). Cooled air is fed from the computer room air conditioning (CRAC) units to the cool aisles under a raised floor through perforated tiles (diffusers) up into the cool aisle, into the equipment and out the hot aisle. The heated air is then returned to the CRAC units.
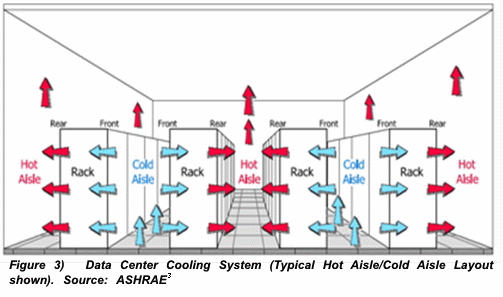
Data center cooling systems have changed little over the past 25 years, but owing to the issues discussed above, new designs are being developed and tested, two are notable; cold aisle containment and liquid cooling. Cold aisle containment uses a raised floor, but contains the cold air between the cold aisle racks, sending the cold air directly to the server inlets, greatly reducing air mixing and short-cycling. Liquid cooling is used within most CRAC units, but liquid-cooled racks take advantage of the enhanced heat transfer characteristics of liquids. Since the CRAC units can be installed outside the main floor area, this design eliminates short-cycling. These systems are significantly more complex and expensive now, but may become more and more important as server densities increase beyond air cooling capabilities.
The electronic, electrical and mechanical components within a data center all generate heat. Unless the heat is removed, the ambient temperature will rise, eventually beyond design specifications resulting in electronic equipment malfunction. The temperature and distribution of air within the room is managed by the air conditioning system and influenced by the layout of the server racks. ASHRAE’s “Thermal Guidelines for Data Processing Environments” recommends a temperature range of 61-75°F and humidity range of 40-55% with a maximum dew point of 59°F as optimal for data center conditions.
The weakest link in the system that can lead to a failure and loss of availability is lurking in every data center. It is the component that is most susceptible to failure by heat at the lowest temperature. But no one knows exactly where that component is located until it fails. Accurate and even cold aisle cooling is the best practice available to a data center operator. Finding and eliminating ‘hot spots’ is the goal of any uptime conscious data center manager. Finding and eliminating ‘cold spots’ is the goal of any energy conscious data center manager. Thermal mapping satisfies both.
CFD Modeling
The data center’s cooling system must be designed and engineered to provide cooling to computer components. The objective of the design of the cooling system is to provide a clear path from the source of the cooled air to the intakes of the servers and to return the heated exhaust air to the CRAC efficiently.
Data centers are usually designed and drawn with computer-aided drafting and design (CADD) software and modeled using computational fluid dynamics (CFD) modeling. CFD is, however, limited by the granularity of input data and as a result, requires many questionable assumptions. No matter how complex and well-prepared, CFD modeling is not reality. Deviations from ideal performance will only show up after physical testing. Also, during and after construction, changes happen. Unforeseen issues like adding servers or increasing server densities are rarely re-modeled after construction. Contractors move equipment, change cabling and conduit routes and HVAC ductwork, inadvertently creating voids and obstructions, reducing or increasing air pressure and diverting the flow of cooled and heated air.
IRt is used to validate the CFD model (in a normal operating condition) and direct HVAC technicians and IT managers to heating problems (hot and cold spots). After repairs have been accomplished, IRt is used to check the repairs.
Thermal Mapping of a Data Center
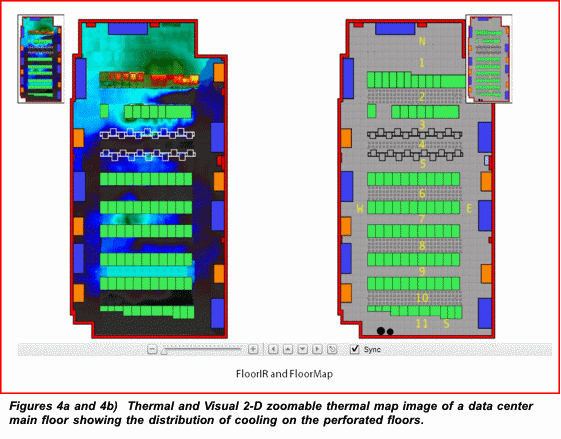
Thermal mapping captures the full “in-situ” thermal condition of a data center and all of its equipment. The key advantage is that it is possible to get an overall view of the thermal condition of the entire room for a given point of time while still having the capability to zoom in on specific problems. This is very different from more traditional methods because it allows overall context and viewpoint selection, much like one gets with CFD modeling…but this is actual thermal imagery. Reports can demonstrate how a local thermal pattern visible in one aisle is actually the sign of a cooling air blockage across several aisles. When the overall layout of the servers, floor, walls and ceiling is available, what appears to be good thermal performance in one image may actually be wasteful excess cooling when the entire thermal map is analyzed. These problem areas are easy to see only with the overall image but impossible to see in single shots.
To create a thermal map, one must collect the thermal and visual imagery in an ordered manner, carefully post-process it into mosaics, and create the construct to display it in 2-D and/or 3-D. To create meaningful reports, the thermal imagery must then be analyzed by qualified personnel.
2-D Thermal Mapping View of Data Center Floors
2-D Thermal Mapping View of Data Center Server Racks
Highly detailed front-facing thermal mapping of server racks (See Figure 5) shows the heat distribution in situ and can be compared to loading. With thermal mapping, it becomes possible to create imagery and make comparisons with the doors open, with the doors closed, from the front and rear of the panels in a side-by-side configuration or any combination.
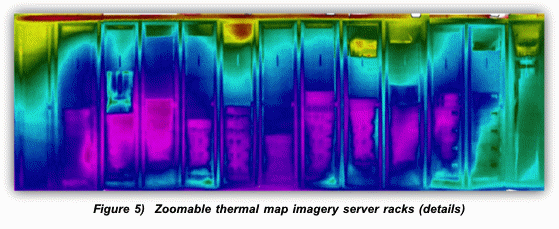
Figure 7 (left) and Figure 8 (right) show loose connections inside an enclosed overhead bus duct.
3-D Thermal Mapping View of Data Center Floors
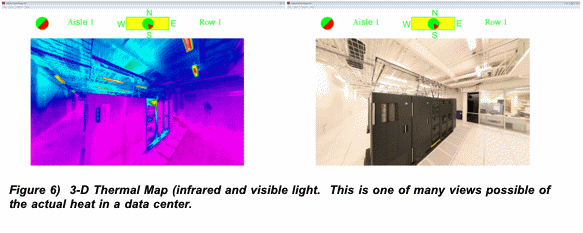
Three-dimensional thermal mapping is a new approach to capturing the thermal condition of a data center and all of its equipment and is the most powerful of all tools for presentation to operators, consultants, contractors and HVAC professionals wanting to accomplish adjustments, repairs and redesigns. A 3-D model can be rotated and viewed from any angle.
Conclusions
Infrared thermal mapping is the perfect tool to help data center owners and operators manage the heat in their facilities. Power, cooling and support systems can all be managed through the sophisticated use of infrared thermography.
Refrences
1 Data Center Knowledge website Miller Webworks LLC.
2 10 Things You Need To Know About Infrared Windows Copyright ©2009 by IRISS, Inc. All rights reserved
3 ASHRAE. 2004b. Thermal Guidelines for Data Processing Environments. Atlanta, GA: American Society of Heating, Refrigerating and Air Conditioning Engineers
4 UpTime Institute, Procedures and Guidelines for Safely Working in an Active Data Center page 9., UpTime Institute (12/18/06)
Author Biography
Gregory R. Stockton is a principal in three infrared companies; Stockton Infrared Thermographic Services, Inc. www.stocktonInfrared.com, United Infrared, Inc. www.UnitedInfrared.com and RecoverIR, Inc. www.RecoverIR.com. Stockton Infrared is a nationwide multi-disciplined infrared service contractor. United Infrared is a nationwide network of infrared thermographers providing training on a variety of applications and the business of infrared thermography. RecoverIR is an aerial thermal mapping company primarily focused on power utility issues such as improving energy efficiencies, weatherization, and identification of lost energy.
Greg is a certified infrared thermographer with thirty years of experience in the construction industry, specializing in maintenance and energy-related technologies. He has published many technical papers on the subject of infrared thermography and numerous articles about applications for infrared. He is a member of the Program Committee of SPIE (Society of Photo-Optical Instrumentation Engineers) Thermosense and co-chairman of the Buildings & Infrastructures Session at the Defense and Security Symposium.


