Article Archive
Temperature Measurement of Plastic Injection Molding Dies
James M. Lies, President
Infrared Predictive Maintenance
P.O. Box 1887
Mishawaka, IN 46546
574- 258-5970
Abstract
Thermographers who are asked to measure targets of low emittance with a particular level of accuracy will incur hardships due to variable or multiple reflected temperatures, varying angles of view, etc. This is typically the case when measuring the surface of plastic injection molding tools. This paper examines these problems, presents solutions and describes an actual methodology used to measure these tools with sufficient accuracy to solve design and production problems.
Introduction
There are many real-world situations where a thermographer must measure the temperature of objects which are of less than ideal emittance. We’ve all seen many. The ultimate burden occurs when we are asked to provide a level of accuracy in that temperature measurement. Suddenly, issues we usually ignore become important and repeatability and other concerns appear. This paper will discuss these while describing a method used to measure surface temperatures on plastic injection molding dies. These seem to bring to bear all the nightmares of low emittance, reflections, varying viewing angles, etc.
The Project, Defined
There are several companies in my part of the country that use injection molding machinery to manufacture different types of thermoplastic products. Their usual interest is to have me inspect and report on problems with electrical support equipment associated with the facility and at times, the machines. These are hydraulically operated presses which close together two formed metal plates sculpted in the form of the product. Molten plastic is then injected between them and allowed to cool briefly. The tool opens and typically a robot removes the part. I’ve been asked on several occasions to measure the temperature of some of the tool faces. When told the first time that the material of the surfaces was indeed smooth steel, I was appropriately horrified. But generally speaking, the client needed to know why various problems were developing in the finished product, from burning the material, insufficient infiltration of the plastic into the tools, warping as the product cooled, etc.
Problems in Measurement
While not the worst environment in the world to measure low emittance objects by any means, the presses bring their share of horrors. One must expect reflections from the cooling lines which carry water to and from the dies. Other sources might include heat from the opposite half of the tool, gibs and reflections from them, and even plant lighting showing through the open top of the press. On the day of measurement, the die’s emittance read approximately 0.16 and displayed plenty of reflections and Lambert’s Cosine effects. The image looked like something out of an amusement park funhouse.

In this light, it is apparent that the use of a remote reading infrared thermometer would be a very difficult approach to tool measurement. Identifying reflections, etc., even under the better conditions which I will describe, would still be crucial, as would knowledge of exactly where and how much area the measurement defined.
Controlling Extraneous Heat
The first line of defense in dealing with heat data corrupted by effects such as those above is to raise the emittance of the target as high as practical. Now it was the client’s turn to be horrified. They did not want foot powder or electrical tape on their finished parts.
One common material placed on dies during production is mold release spray. With the help of this material the machines cleanly eject finished parts from the dies. Various brands displayed emittances of 0.18 to about 0.4 and some of the latter were used to make actual tool measurements. The most recent improvement was the suggestion by engineers on site to try mold maker’s die. They contacted their tool maker, who hand delivered the die and we proceeded to coat the tools. This die measured 0.65, our best emitter.
A surface with emissivity 0.65 still reflects at 0.35 efficiency, though. Moving the camera evidenced reflections which might still be of concern. Rather than try to evaluate temperature errors likely to result, heat sources were blocked as best we could. The cooling lines dangling from the fixed (“dead”) half of the tool and in the aperture between that and the movable (“live”) half were covered with cardboard. Its paper assumes ambient temperature fairly quickly and, since there were no fans in the enclosure to complicate things, this gave us an even background temperature. We were tempted to open the press stroke fully to accommodate a more direct view of the tools; in fact in some cases we did. It is necessary to prevent the opposite half of the tool from effectively reflecting its or other heat onto the tool currently being observed so one cannot accept a view that is too perpendicular to the target surface. One approach, of course, is to block the heat from the opposite half with cardboard, but it’s not always practical to insert that for safety and operational reasons.
Taking the Data
At this time I determined a figure for ambient (background) temperature. This was also an opportunity to establish emittance of the coating. The overall image was checked by moving the camera to be sure no stray reflected heat was going to be in an area we absolutely needed to measure, or the reflection was of nominal consequence. The locations of any significant reflections were noted, then the camera was mounted on a tripod. We marked the floor with tape to help get back to this location after imaging the opposite half of the tool. Finally, I prepared the opposite half image in a similar way.
Normally, the data required are temperatures at equilibrium, or quiescent temperature. The press must continue to operate until this occurs; in my applications the heat was supplied by the molten plastic and the dies were cooled by water flowing in channels inside. Forty-five minutes to two hours operation may be required, depending on the tool, the plastic and the size/shape of the product. I could observe the tool or check with the engineers or operators to establish how long it took to warm them up. The operator had to pause production and open the door to provide time to observe.
Once temperatures were at equilibrium, I notified the operator to coat the tools with our high emittance material once again (and at different times during the measurements as necessary). He ejected a part, retracted the ejector pins, and opened the door as required. This was repeated each time I took the data. It was occasionally necessary to produce a couple of extra parts in order to return the tool to temperature, since it cooled while it was paused. Before imaging the tool I again notified the operator to pause the machine when the part cleared the press, retract the ejectors, and open the door. It’s best to take the data as quickly as practical and get the press back into operation to maintain temperature. I then moved the tripod to the second set of taped marks and in a couple of cycles, it was safe to take data on the other half of the tool.
The requirement of temperature data over a time span necessitated that we repeat this process at 1/2 hour intervals. Since a tripod was employed besides our care in setting up, repeatability was very good, close to the camera’s specifications. The engineers might have been looking for restrictions developing in water channels or insufficient/excessively wide channels, insufficient or excessive temperatures exposed to the plastic, etc. These cause parts with burned plastic or voids in plastic penetration of the tool, warping upon cooling, etc. Whenever this occurred during our measurements, it was documented.

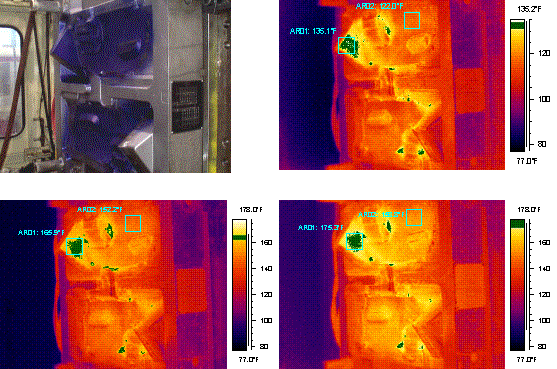
Fig. 2. As the die heated beyond normal (bottom right), a problem
in the water temperature controller was discovered and corrected.
Reporting
As noted during the taking of data, I avoided using areas where the viewing angle was sharp – the effective emittance is unknown, as frequently may be the reflected temperature. I used adjacent “flat” areas, as required, to read temperatures. Some of our most flashy analysis tools – line profiles, isotherms, 3D displays, etc. are often useless in showing hot and cool areas. Spot or area temperatures seem the best. It’s useful to display the images using the same temperature scales for comparison, where doing so yields an image which shows the warm and cool areas of interest. Due to fault conditions in the equipment, I was forced to vary the temperature scales.
Conclusion
Infrared images can deliver meaningful temperature data to tool engineers so they can diagnose problems in the operation or design of steel dies. Care must be taken to assure integrity and repeatability of the data. The keys are to raise the emittance of the target, bring reflected temperatures into uniformity, know or control them in some manner, observe and if possible avoid areas where the viewing angle is sharp, and use a tripod for the most repeatable results.
Advertisement


