Article Archive
Thermographic Inspection of Building and Roof Water Intrusion in the State of Florida
James Brady
Level III Certified Infrared Thermographer
Brady Infrared Inspections, Inc.
935 Pine Castle Court
Stuart, FL 34996
Ph: 772-288-9884
Abstract
Public awareness of mold and moisture-related sickness has grown over the past few years. This awareness has demanded that water intrusion problems in buildings be solved. Infrared technology has been shown to be a viable tool for meeting some of these demands, as evidenced by some cameras being designed and manufactured specifically for the task. By far, the leading causes of water intrusion problems are inferior design and construction, and the natural degradation of water-sealing building materials over time.
As a thermographer performing infrared surveys on buildings and roofs throughout the Southeast US over the past several years, I have been provided some great opportunities to observe a wide variety of water intrusion problems. This paper contains several case studies of infrared inspections performed on buildings that have experienced water damage caused by hurricanes, summer climates of extreme heat, high humidity and heavy rains, and other age-related ailments. Infrared images showing delaminating stucco, wall cracks, deteriorated sealants, roof damage, and other related problems are presented.
Introduction
Florida’s weather conditions are taxing on buildings. For more than six months during the year, heavy rains with hot humid temperatures are the norm. On top of that, the state commonly experiences tropical storms and hurricanes; storms that reveal a building’s true vulnerability to water intrusion. Solving these problems is becoming a main priority for engineers, maintenance personnel, and others responsible for building care. Fortunately, the building technology sector is fast realizing the potential of infrared technology to provide condition assessment of their facilities and help determine the resources necessary for remediation.
As a thermographer performing infrared surveys on buildings and roofs throughout the State of Florida over the past several years, I have been provided some unique opportunities to observe a wide variety of water intrusion problems. This paper contains several case studies of infrared inspections performed on buildings that have experienced water damage caused by hurricanes, summer climates of extreme heat, high humidity and heavy rains, and other age-related ailments. Infrared images showing delaminating stucco, wall cracks, deteriorated sealants, roof damage caused by wall problems, and other related problems are presented.
But before we look at these studies, I would like to share a few tips and observations I have made along the way that have made my inspection time in the field more productive and have helped me to produce accurate and professional reports.
Useful Stuff I Have Learned
Field Maps
One of the most useful things to come along in recent years is Google Earth (GE). Before a project starts, I log on to GE, locate the property I am inspecting and make copies of the building’s aerial image to serve as field maps. If the inspection is going to take me inside the building, I obtain a copy of the building’s evacuation map for each floor (usually hanging on the wall next the elevator) and use this to locate the look direction of my images and write notes on them. Much later in the project, these same base maps are inserted directly into the report thermogram pages to serve again as photo reference maps. This one step has eliminated the need for me, in all but a few cases, to measure out roofs, buildings, and interior rooms and then transfer these data into a computer drawn site map. If the image quality in GE is not up to par, you can import the image into your favorite draw program – mine happens to be PowerPoint – and trace the outline of it to create a straight-line drawing of the building/roof.
Another helpful practice is to identify leak sites throughout a building and/or roof and mark them on your field map(s) with the help of the building owner / engineer prior to conducting an inspection. Once located, you can use this as a guide to perform your inspection in all possible places of access in and around the leak.
Familiarity with Your Subject
You should know something about the system you are inspecting. This may sound obvious, but knowing about the building’s construction, what type of roof insulation system is present, if there is a multi-roof system present, the location of water leaks, and other problems the building is suffering from is fundamental information that is necessary to perform an effective inspection. Not only does it help you to anticipate what types of thermal patterns you may observe, it also may provide clues as to where water may be entering and migrating into a building.
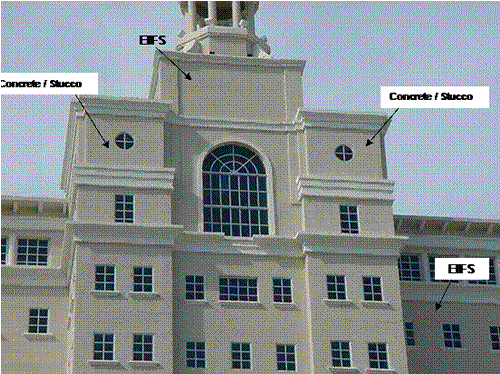 |
| Figure 1. Here, the generalized construction pattern of a building has been established to provide an idea of possible thermal patterns to look for during the inspection |
How does one find out this information? In some cases, the building manager and/or contractors who work on the building may have as-built drawings or first-hand knowledge of the building/roof construction. Also, there are specific roof designs for installation over different deck systems. Commercial roofing suppliers and roofing manufacturers can provide these “spec books”.
Other places to look are in the building itself. Usually, unfinished parts of a building reveal information on general construction design. These areas may include storage rooms, loading docks, electric rooms and other unfinished areas in the building. One of the best places to look is above drop ceiling tiles. Here, you will usually find the exterior and interior wall system, the transition between the walls and roof, and the roof deck. The last place to check is at the building wall itself. Tap on the wall to see if it is Exterior Insulation & Finish System (EIFS), concrete, or some other material.
I often stop at construction sites to observe the various phases of construction. If you do this, after a while you will see a pattern emerge of two or three basic construction techniques that are unique for your part of the country.
Cameras
It is difficult to keep track of the new cameras and features that are being introduced into the market, unless you are considering purchasing one. Suggesting which camera to buy is a personal choice dictated by your needs and budget. What has worked well for me is a camera that has excellent thermal sensitivity, has the ability to tightly adjust the temperature span, has a high resolution detector, and can accept a variety of lenses.
The camera’s thermal sensitivity (the ability for the detector to actually discern a temperature difference across a surface) and its ability to generate a tight temperature span (the smaller the span the greater the thermal resolution for a given temperature range) will determine if you see anomalies or not. Keep in mind that some thermal anomalies you will find may have temperature differences of 1.5 to 2 F degrees. If your camera has a thermal sensitivity greater than this, you will miss anomalies. Furthermore, if your camera does not have the ability to generate a small temperature span, you may lack the resolution necessary to identify an anomaly, as 1 and 2 F degree changes will get lost in a particular color scale on your camera.
If your budget allows, spend the extra money to get a high resolution detector. This will make life in the field much easier by providing you crisp and detailed images and provide high quality report images.
Another critical component of an infrared camera is its ability to accept both wide-angle and telephoto lenses. Most of the walk-on roof scans we perform are conducted using a wide-angle 36-degree lens, while multi-story building inspections are performed using, 24- to 8-degree lenses. Investing in additional lenses is well worth the cost and in some cases is the only way to obtain meaningful information.
Moisture Meters
While infrared technology is non-contact and non-invasive, eventually, verification testing of the thermal anomalies you present must be conducted. This ultimately should be performed by a qualified person who is familiar with the structure under study. However, having the means to interpret and understand the anomalies you are seeing can be aided by a moisture meter.
There are two basic types, non-penetrating and penetrating, which are further broken down into various models and features. The non-penetrating meters are the easiest to use, requiring just good contact against the surface you are testing. The penetrative types require that an opening be made in the testing surface so that the meter’s prongs can be inserted into the material you want to test.
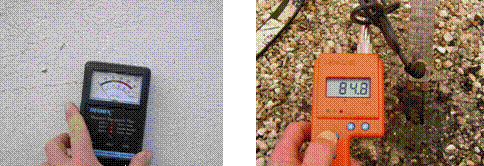 |
| Figure 2. A non-penetrating moisture meter is shown at left and a penetrative type at right |
While moisture meters are easy to use, they have limitations. First, false positive readings are easy to get if you are unfamiliar with the medium you are testing. Conductive material that comes into contact with the meter’s contacts will cause positive readings. This includes metal deck surfaces, metal lathing used as foundation for stucco finishes, rebar in concrete, and conductive minerals sometimes found in lightweight concrete roof insulation. Second, moisture meters should be used for qualitative results. If quantitative results are necessary, ASTM testing labs should be used. Finally, moisture testing can be destructive. If any questions exist regarding repairs or testing procedures, have someone else who is qualified perform them. For instance, I do not perform penetrative testing on EIFS or concrete walls. Whenever we have to perform moisture testing on a roof, a certified roofing contractor is present to cut and repair the roof. If lightweight concrete insulation is present in a roof system, we recommend that moisture-by-weight percent testing be performed by a certified testing lab.
Best Times to Scan
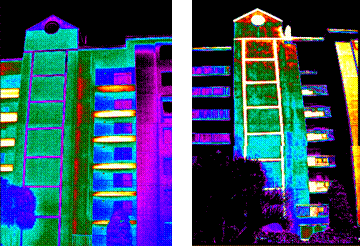
You and your client should not expect to get complete results with just a single scan. A typical job involves at least a “cooling” and a “warming” scan. Obviously, cooling conditions are best at night and warming conditions during the day; however, it is important to realize that since building walls face different directions, they will experience warming and cooling events at different times of the day. East walls will warm in the morning and cool during the afternoon, whereas west walls follow the opposite pattern. South walls may stay warm throughout the entire day and only cool at night. North walls, although they rarely have direct solar loading, will capture solar energy from nearby buildings and also will undergo ambient temperature changes. Delta temperatures will not be as significant here as on other parts of the building, but thermal patterns will be detectable.
| Evening scan (cooling) vs. afternoon scan (warming) | |
 |
|
|
Figure 3. Infrared image on left shows thermal pattern on building’s stairwell tower wall during an evening scan under cooling conditions. A thermal anomaly
can be seen along the inside corner of the stairtower and trash chute. |
Infrared image on right shows thermal pattern on building’s stairwell tower wall during an afternoon scan under warming conditions. A mottled thermal anomaly can be seen on the front face of the stairwell tower, possibly showing areas of delaminating stucco.
|
Scanning buildings at and near the ocean can create difficult conditions with ever prevailing winds. It is best to start your scanning earlier than normal during cooling conditions and be prepared to loose your imaging window much sooner than normal, given the accelerated cooling created by the wind. If wind becomes too strong, thermal patterns may be absent or distorted.
Only when I am sure that I have seen every building wall during at least one cooling and warming event and the roof under cooling conditions, do I concede that the scan is complete. As with any inspection, there may be times when certain walls or parts of walls and roofs cannot be scanned, either because of trees, continuous shading, irregular exposure to sun, excessive hot or cold exhaust from fans, etc. When confronted with these obstacles I usually don’t spend too much time tying to resolve them; rather, I include in my report that limitations were encountered.
Dealing with Rain
Rain is a problem if it occurs immediately before or during an inspection. I have seen thermal patterns of evaporating water on walls shortly after a rain event that could be mistaken for anomalies. Rain will also cool surfaces very quickly and retard thermal transmission. It is important that the wall and roof surfaces are dry during a scan. This excludes active leak sites that may have water migration near the wall surface.
On the other hand, rain occurring one or two days prior to an inspection can be beneficial. Water migration in many building and roof leaks have very short resident times. Granted, most roof and EIFS insulations will hold water indefinitely, but certain foam insulations and concrete structures do not. If wallboard is left to dry, it will not readily show a thermal anomaly. So, having water enter the system from time to time can be all that is needed to see significant anomalies versus seeing nothing. The images below (Figure 4) exemplify how time sensitive some inspections can be with respect to rain.
 |
|
Figure 4. Infrared image on left shows penthouse wall void of any thermal anomalies during dry period and the same wall, on the right, one day after a rain event showing a radial thermal pattern of moisture
|
Delta-Temperature Problems
Unique to Florida’s weather is that during rainy parts of the year (summer months), delta-temperatures can be as low as 6- to 8-degrees from a daytime high to an evening low. It stays warm well into the evening hours and gets hot very early in the morning. I didn’t give much thought as to how this may affect infrared inspections until I recently observed thermal patterns on walls that contradicted what I was expecting to see. What I observed were warm anomalies on walls that were warming early in the day that tested positive for moisture (Figure 5). Under normal conditions, this relationship should be just the opposite. The only explanation I can offer is that the water laden areas of the wall never reached a temperature inversion with the dry sections of the wall throughout the evening hours. Therefore, only during the hottest parts of the day would the dry and wet sections of wall be at or close to the same temperature, and at all other times, the wet sections of wall would show up as warm areas.
 |
|
Figure 5. Infrared image shows thermal anomaly of trapped moisture in wall during an early morning scan. Area of anomaly tested positive for moisture using moisture meter
|
Another challenge low delta-temperatures create is faint thermal patterns on walls. Compounding this problem is the fact that most buildings have structural variations that cause non-uniform warming and cooling of walls throughout the day. For instance, a balcony or a main divider wall between two condo units may impart shade on certain parts of a wall for a period of time while others areas may receive direct sunlight. With low delta-temperature conditions superimposed onto an already non-uniform thermally loaded wall, it is necessary to adjust the level and span on your camera to obtain meaningful data. One of the easiest ways to accomplish this is to bring a particular section of wall you want to inspect into the camera’s field and do an auto-adjust of the level and span. It is important to remove any wall or subject matter that you do not want to inspect out of the field of view of the camera. Since most of the thermal anomalies are going to be very slight, a very small temperature span focused around the wall is needed. Do not be surprised if you have to perform this function numerous times as you work your way around a building.
Don’t Be Afraid to Look
Another useful practice I use when performing an inspection is to look beyond the surface I am imaging. This usually requires performing a visual inspection in areas above drop ceiling tiles, interior sides of roof leak sites, exterior sides of interior leaks, and any other area adjacent to thermal anomalies that may provide clues as to why and where water is entering a system. It can also help you validate what you think you are seeing in a thermal pattern.
Don’t worry if you cannot initially explain a thermal pattern. If you take the time and look in areas that you normally would not, most of the thermal patterns can be understood.
The series of images below demonstrates the importance of investigating your anomalies.
 |
|
Figure 6. The left infrared image shows a thermal anomaly on the side of brick column. Inspection above the tile ceiling shows a cold anomaly of tracing water directly below the brick column
|
 |
|
Figure 7. The left infrared image shows a thermal image of a roof taken from a higher roof showing a warm anomaly on the side of a metal panel wall. Conducting a thermal and visual inspection of the interior side of the wall (middle and right photos), above the drop ceiling, confirmed that the thermal anomaly did, in fact, represent moisture
|
 |
|
Figure 8. The left infrared image shows a thermal image taken along the same metal panel wall tie-in with the roof in Figure 7. Small, yet strong thermal anomalies were detected, yet no moisture was found in the roof during destructive testing next to the anomalies. Conducting a thermal and visual inspection of the interior side of the wall (middle and right photos), above the drop ceiling, confirmed that the thermal anomaly did, in fact, represent moisture (dark area at arrow in visual photo) that was migrating along the edge of the metal roof deck
|
Use Composite Image Software
Whenever I am scanning large subjects such as the sides of buildings, large roof areas, or close-in work in an interior room, I will take a series of thermal images to be used to create a composite image. I find FLIR’s Image Building program invaluable for this task, but I have been told that Adobe Photoshop and other similar programs work well. The final product shows the “big picture” rather than a series of smaller isolated images that tend to make reports disjointed and confusing to the client. The trick to making your final image look balanced is to photograph your subject from one side and from one spot. By doing this, you keep the point of perspective in sync with each successive image you take. I have had poor results capturing images facing perpendicular to a subject as I move a few tens of feet between shots.
Keep in mind that you have to bring each image you want to snap together to the same temperature level and span prior to moving them into the composite program. Once assembled, the image can be imported into report thermogram pages.
 |
|
Figure 9. Creating a composite image from a series of single infrared thermograms (shown here is the side of building) provides a “big picture” that adds clarity and perspective to your images. You should notice that each single image has a common overlap with the adjacent image that makes it easy to connect the images into one
|
A Look at Thermographic Case Studies
I have organized this section of the paper to include various types of building systems common to Florida that I have encountered while performing infrared inspections. For each system, I have presented examples of thermal images and a brief explanation of my experience with each one. Generally classified they are: Exterior Insulation & Finish System (EIFS), Concrete Masonry Units (concrete block), Wood Frame, Brick, Roof Systems, and Interior Walls.
Exterior Insulation & Finish Systems
Exterior Insulation & Finish Systems, commonly referred to as EIFS, are a non-bearing exterior cladding used to weatherproof, beautify and insulate commercial buildings with moisture sensitive sheathing or framing. The cut-away diagram below shows the basic components of this system, but keep in mind other similar systems with minor differences also exist.
 |
|
Figure 10. Cutaway diagram at left showing main components in an EIFS construction (image courtesy of Total Wall Inc.). Middle photo shows the exterior finish, fiberglass mesh and internal foam. Photo at left shows exterior drywall fastened to metal stud wall system.
|
What qualifies EIFS to be an excellent candidate for infrared technology is that the foam insulation collects and holds moisture if the exterior coating is punctured or if flashing and joint details fail.
Thermal patterns I have observed on EIFS vary and can be very strong, blotchy, shadowy and/or faint.
 |
|
Figure 11. Examples of trapped moisture within EIFS wall panels. Areas of moisture are represented as orange patterns on wall
|
Other types of foam building materials include copings, cornices, trims and bands that are applied directly to the exterior of buildings. Some of these architectural accents are glued in place and others are mechanically fastened. Depending on their span lengths, they will inevitably have joints that are sealed with caulk. Water entry points on these types of products are in three places: through the surface if it is not sealed correctly or is sealed using cheap materials, at the caulk joints, and where the mechanical fasteners enter through the attachment wall.
The images below show an example of water migration through open caulk joints on a foam sill fastened atop a concrete block parapet wall.
 |
|
Figure 12. Infrared image shows migrating and trapped moisture. Middle image is control picture showing location of one of several areas where caulk joint is open as shown in right image
|
The images below show an example of water migration through a mechanically fastened foam coping detail. Water originally entered into the foam material because of a poor quality finish coating.
 |
|
Figure 13. Infrared image shows trapped moisture in foam coping detail as dark areas at arrow. Middle image is control picture showing foam detail and right image shows water migrating into block wall at arrow. Images captured within 6 hours of a rain event during a warming cycle
|
Concrete Masonry Units (CMU) Construction
Concrete masonry units (CMU), commonly referred to as concrete blocks, are one of the most commonly used building materials in Florida. Both commercial and residential builders take advantage of this easy to install and extremely strong building design. CMUs in their raw form are extremely porous and absorbent. Therefore, an exterior finish is required to make this building system waterproof. Three finishing designs that I have observed are: waterproof exterior coatings, stucco skim coating, and wood and/or cement based sidings. Of the three types of finish materials mentioned here, I have observed thermal anomalies related with the waterproof coating and stucco systems.
Direct Applied Coatings
Direct applied coating products are usually water-based elastomeric materials that allow moisture to escape from the block and prevent water from entering. Water intrusion problems can arise from improper application methods and natural degradation of the material over time. Another way water can enter this system is from hairline and surface cracks that break the coating surface, thereby providing direct pathways for water into the block framework.
 |
|
Figure 14. Moisture infiltration on concrete block walls with elastomeric coating. Image on left shows a hairline crack in the wall where water is entering the wall. Image on right shows a coat system that is breaking down, allowing moisture to be absorbed through the block face
|
Stucco Coat
Stucco over CMU is popular, in part, because it is very durable in high humidity environments as are found in Florida. It can be applied directly over concrete block or applied over metal lathing that is mechanically attached to the block. To help control surface cracks, control joint details are commonly attached to the block that serve as partitioning boundaries. When metal lath is used, vapor barriers are sometimes applied as a base material to the block to enhance waterproofing capabilities.
 |
|
Figure 15. Image on left shows direct applied stucco over CMU that is de-bonding. Middle image shows vapor barrier directly applied to CMU prior to metal lath and stucco finish. Image on right shows mechanically fastened metal lath and control joint bands applied over moisture barrier and CMU
|
After the active hurricane season of 2004, concerns were raised about how well stucco resists wind-driven rain. A joint study was performed by the Florida Concrete & Products Association (FC&PA) and the National Concrete Masonry Association (NCMA). The studies showed that stucco applied at 1/2 inch thick or greater provided excellent resistance to moisture penetration at winds up to 155 miles per hour at 24 hour exposure. The study also showed that “at 180 mph, the amount of dampness on the leeward (non-wind) side of the wall was similar for both stucco material thicknesses (1/4 and 1/2 in. or 6 and 13 mm). The thicker coating allowed much less water penetration – measured by water collected on the bottom of the cells on the flashing – than the skim coat (1/8 in. or 3 mm) at extended time and pressure”.
So what kind of problems with stucco can be detected with infrared? It has been my experience that surface cracks, debonding flaws and control joint failures all are readily detected by infrared. In addition, any and all of these problems can allow water to enter and migrate through a block wall system, providing thermal patterns commonly associated with trapped moisture.
Wall cracks and delaminated stucco usually appear as warm thermal anomalies during an initial warming cycle but slowly disappear as warming continues. The two images presented in Figure 16 were taken during the early to mid-morning hours as the sun loaded up the walls.
 |
|
Figure 16. Image on left shows a vertical crack in stucco warming much quicker than the surrounding wall during an early morning sun. Faint thermal halos on the side of the crack are areas of de-bonded stucco. Image on right shows an area of de-bonded stucco (orange area)
|
Surface cracks provide excellent pathways for water entry into a wall system. They can also help promote stucco de-bonding. The infrared images below show examples of wall cracks that have lead to probable water migration and stucco de-bonding. Notice the left image in particular that shows possible moisture, (purple and blue areas) that has collected in the wall system by entering the horizontal crack.
 |
|
Figure 17. Image on left was taken during an early morning sun and shows a horizontal crack in stucco with possible trapped moisture seated in the wall (blue/purple area). Right image shows a vertical and horizontal wall crack up high with possible trapped moisture and stucco de-bonding (orange areas). Areas of stucco de-bonding were tapped with a hammer to confirm their condition
|
Another feature that can lead to water intrusion problems with stucco is control joints. These are usually plastic bands that separate large wall surfaces into smaller areas to diminish the possibilities of “runaway” wall cracks. Figure 15 shows an example of how a control joint is installed to a wall system using mechanical fasteners. Either a loose fastener or a poorly installed joint can lead to a pathway for water entry. The images below show an example of trapped moisture in a wall system because of an improperly installed control joint.
 |
|
Figure 18. Image on left shows trapped moisture in a stucco wall system below a control joint. The right image shows an opening in the joint at a corner seam that is allowing water to enter the wall
|
Wood/Metal Frame
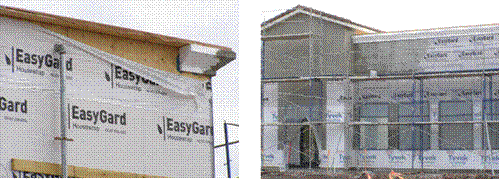
Wood and metal framing is commonly used in Florida for both residential and commercial buildings. They are flexible in their design potential and go up quickly to meet construction schedules. Vapor barriers are a must for this type of construction and are stapled directly to the plywood or other sheathing material before the finished product is applied. Foam cornices and other trim accent pieces are also commonly installed on this type of construction. Two of the most common finishing systems to cover framed construction are stucco finishes and wood or cement based siding products. While I have yet to see thermal anomalies associated with concrete siding products, I have seen problems associated with stucco and wood siding materials.
 |
|
Figure 19. Image on left shows wood framed commercial building with vapor barrier applied. Note the foam trim piece applied in the upper right corner to make up the eave of the building. Image on right shows stucco being applied over metal lathing on a different section of the building
|
Stucco Finish over Frame Construction
As stucco finish requires a base of metal lathing that is mechanically fastened to the wood siding. The same types of thermal patterns observed with stucco over concrete block are observed with stucco over framed construction. The following images show examples of trapped moisture and/or other structural deficiencies on stucco systems that have been applied over framed structures.
 |
|
Figure 20. Infrared image showing examples of deficiencies (orange areas in images) in stucco finish coats applied over framed construction
|
Wood Siding on Frame Construction
Following an active hurricane season in Florida a few years ago, I was asked to provide a condition assessment survey for a condominium association located on the beach. The association had hired a contractor to perform remediation work on several of the multi-story condo units and wanted to verify that work was being done according to the project specifications. The units were framed with T-111 wood siding. The roof system was a combination of shingles on sloped wood deck and modified bitumen on flat wood deck. The images below show the results of this project.
 |
|
Figure 21. Infrared image showing trapped moisture (orange areas) in wood siding and sloped wood sheathing on a shingle roof system
|
 |
|
Figure 22. Infrared image showing trapped moisture (orange areas in images) beneath a shingle roof system. Edge metal flashing was not installed correctly and allowed for moisture to enter the wood deck
|
 |
|
Figure 23. Infrared image showing trapped moisture (orange areas in images) in wood siding of a condo unit
|
Following the submittal of our report, the deficiencies sited above along with several others were verified by the contractor and corrected. It was found that the contractor was not aware of the water damaged wall siding and had failed to replace rotted and water soaked roof decking prior to installing new roofing material.
Brick
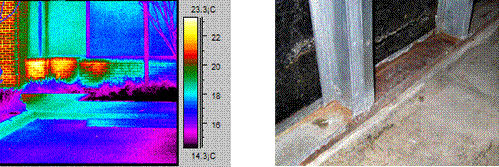
Brick construction is not as prevalent in the southern part of Florida as it is in the central and northern parts. I have, however, performed infrared inspections on brick construction with exceptionally good results. Thermal patterns associated with water intrusion on brick are very predictable – cold anomalies during warming phases and hot anomalies during cooling.
A few years ago, I was hired by the Florida Department of Transportation to perform an inspection on one of their buildings that had mold. What made this project especially educational was that some of the areas inside the building were already in remediation phases, so the interior wallboard was removed, exposing the interior side of the framing and brick. It was invaluable to see thermal anomalies I had identified correlate with areas of known moisture. This gave me and my client confidence to predict where other areas of moisture could be expected. Images collected during this project are presented below.
 |
|
Figure 24. Infrared image on left showing trapped moisture (orange areas in images) in brick. Image on right shows back side of brick with water retardant coating and rusted metal studs from seeping water
|
 |
|
Figure 25. Infrared images showing trapped moisture (orange areas in images) in brick
|
Roof Systems
Following a series of hurricanes in Florida, I came across a thermal anomaly that occurred on both a wall and a roof section adjacent to the wall. At first, I thought the roof anomaly was caused by thermal reflection from the wall, but when the moisture meter tested positive in the roof I had to reevaluate my assumption. The roof area with the anomaly was void of penetrations and appeared in excellent condition, other than the fact that it had trapped moisture. Upon testing the wall for moisture and getting a positive result, I realized that the roof moisture was originating from the building wall. When asked, our client confirmed that roof flashing and a door threshold had blown off during a storm, exposing the wall to water. Since that time, I have come across similar cases where I am able to identify cracks and other flashing details on walls that provide pathways for water migration into roof systems.
Below are a couple of cases where I have had excellent correlation between wall and adjacent roof anomalies that have tested positive for moisture in both the roof and wall.
 |
|
Figure 26. Infrared images showing trapped moisture (orange areas in images) in roof system. Areas on walls tested positive for both moisture and stucco de-bonding and were directly correlated to extensive wall cracks
|
Interior Walls
With mold awareness peaking over the past few years, infrared cameras have become the “go to” tool to provide visual documentation of moisture conditions inside of buildings. Most of this work involves interior wall space with drywall being the host for moisture. Two basic types of water intrusion that affect interior walls and that are detectable with an infrared camera are tracing water and deep seated moisture conditions. The thermal patterns associated with these are different from each other as explained below.
Tracing Water
Tracing water conditions are best seen during rain events or shortly thereafter. In most cases, the thermal anomaly you see will be cold as a direct result of the actual water temperature being cooler that its surroundings or because the water is evaporating as it is exposed to the interior air.
 |
|
Figure 27. Tracing water trails (black/blue/purple colors) on an atrium wall during a rain storm. An inspection on the outside of the atrium showed that the windows (shown in black at top of image) were leaking
|
Tracing water patterns are generally long, thin, amorphous patterns that mimic the water migration path it is revealing. In some cases, you can trace the water marks back to their source (where water is entering the building). In figure 27, the image shows water tracing down an interior wall on an atrium with a series of windows above. It can be seen from the image that the water is originating from the window.
Deep Seated Wall Moisture
Most of us relate water intrusion inside a building as a specific leak site, say for example around a window frame or door jamb. Moisture in the form of water vapor can also produce water damage on interior walls and this damage can be readily detected with infrared. When faced with such situations I find the use of a moisture meter invaluable. It will help verify anomalies and help you become more efficient during the survey. The following case studies show how moisture can migrate into buildings in the form of vapor and cause mold and moisture damage on interior walls.
The first case was a bank building that was constructed of concrete block with a stucco finish and drywall attached to studs on the interior side. During the inspection, I noticed a large thermal pattern on an exterior wall. My moisture meter showed that the first 1.5 inch depth of the wall was dry (the penetration depth of the meter is 1.5 inches). An inspection of the roof and drop ceiling in this area showed no irregular thermal patterns. Upon inspecting the interior side of this wall I noticed a warm thermal pattern that cooled from the top to the bottom of the wall. A moisture meter confirmed that the warm section of wall had a high moisture content.
 |
|
Figure 28. Infrared image on left shows an exterior wall with a thermal anomaly that tested dry for moisture at a depth of 1.5 inches into the wall surface. White box on image shows approximate location of interior wall as shown at right. The image on right shows the interior side of the wall that tested positive for moisture in the upper section of the wall
|
Upon submitting the results to the client, he told me that several years ago the exterior wall had numerous hairline cracks that allowed enough moisture into the building so that the interior drywall had to be replaced because of mold damage. The cracks on the wall were repaired and repainted and the problem was thought to have been corrected. It was apparent from our scan that although the exterior side of the wall was void of moisture, moisture was still present within the wall system and mold growth behind the wall was very likely.
Another job took me to a local hospital that was experiencing condensation dripping from the ceiling inside a newly constructed operating room. For sanitation reasons the room was always kept under negative pressure. When the condensation problem arose, it was believed that a steam leak from piping above the ceiling was to blame. The use of ultrasound ruled out a steam leak.
My next step was to check the exterior side of the ceiling area where it met the roof. A thermal anomaly was discovered in a section of the roof flashing along the operating room wall. I also found warm air being drawn into the room along the roof deck inside the drop ceiling. The client followed-up our work with another contractor who used smoke to trace the airflow into the operating room. His results were very close to our initial findings; warm humid air was entering the room via the flashing detail along the roof system.
 |
|
Figure 29. Infrared image on left shows an exterior wall with a thermal anomaly (orange area) that tested positive for moisture. This wall flashing ties into the upper ceiling area of the operating room. Right image shows the interior side of the roof deck showing warm humid air being drawn into the open ceiling space
|
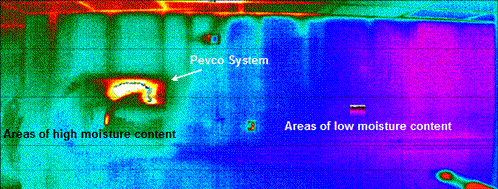
While on the same job, we were asked to see if the interior walls of the operating room had suffered moisture damage because of the looming humid conditions. The results of this inspection showed that one of the main walls had a faint thermal pattern that tested positive for moisture. The anomaly started on the side of the wall closest to the wall that connected to the outside and gradually faded into a normal thermal pattern that tested dry with a moisture meter. It was evident that the warm humid air had migrated behind the walls and was now migrating into the drywall.
 |
|
Figure 30. Infrared image showing faint thermal pattern of moisture in wall. The wall temperature difference from high to low moisture areas was less than 1.5 F degrees
|
Conclusion
Florida’s unique climate presents challenges to thermographers in the building science sector. When consumer demands for thermal imaging services are at their highest, so are hot, humid and rainy weather patterns that bring with them low delta-temperature changes and wet scanning conditions. Learning to use these obstacles to your advantage as well as familiarity with your camera’s capabilities can provide successful scanning year round in Florida. Also, having a good set of base maps to work from will make your time in the field and office more productive.
Understanding not only climatic patterns but also local building designs for your area will greatly increase scanning results. Each system has unique thermal patterns associated with it. Knowing where construction weaknesses that allow water intrusion and other deficiencies to develop in building systems are will increase your awareness of what to look for and where to look.
Finally, not every anomaly documented will be understood. Using a moisture meter can help verify some anomalies and provide confidence in your work. Other anomalies may only be rectified through destructive testing, often times carried out by other contractors. If possible, following up with your client to learn of project outcomes will further your understanding of the thermal anomalies you uncover.
Advertisement


