Article Archive
Active Thermography: An Overview of Methods and Their Applications in Use Today
Michael R. Sharlon, President
Thermasearch, Inc.
1215 Sturgis Road
Conway, AR 72034
Ph: 501-513-9901
Abstract
Currently, there are several forms of active thermography. This paper will introduce thermographers to the different methods of active thermography and will give a brief overview of each method. Some types of active thermography discussed will include reflective or transmissive heating as applied to pulsed, pulsed phase, lock-in, vibro, thermoelastic stress analysis and thermomechanical couplings in solids thermography. Also covered will be current and possible future uses for active thermography.
Introduction
Active Thermography (AT) is defined as applying a stimulus to a target to cause the target to heat or cool in such a way as to allow characteristics of the target to be observed when viewed by thermal imagery. These observed characteristics may be flaws sought in Non Destructive Testing (NDT) or norms sought in quality control.
What separates active from passive thermography is the intentional application of heating, chilling or stress (active) that results in a temperature rise or fall in a target, as compared to an otherwise in situ (passive) target.
We might also break AT into simple and complex. In simple AT the approach is one of applying heat and looking for a defining delta T on the surface of a target. Complex active thermography generally employs one or more requirements for time, intensity, sequence synching, heat generation/application and temperature data/view in correlation with observed Delta T’s on the target’s surface. The additional features of complex AT allow its use in material irregularities that otherwise might not be visible in simple AT. The additional features may also provide more definition, depth and site detail.
Discussion
Simple AT approaches supply quick (scan time) and, when practiced, repeatable results. Examples of simple approaches might include: alternate heated and cooled rooms in a building to allow viewing possible moisture in walls between rooms, supplying hot water to cold water pipes to find water line leaks in building concrete slabs and heating auto dashboard surfaces to detect voids.
Complex AT approaches are more costly in time and resources but generally provide more detailed results. Examples will be provided later in this paper.
An example of simple AT developing into complex AT might be found in the military use of heating the surface of a composite aircraft wing and looking for voids or delaminations. The first approach of using hot air took time. Next, a pulse of high intensity light was used to quickly heat and allow for quick cooling of the surface. But this required faster IR scan rates, which was offset by synching the flash and image timing. Today, even the spectrum of light and timing is varied to affect the heating or viewing of the composite or metal surface.
History of AT Development
Active thermography is an outgrowth of questions about the possible use of newer and better IR equipment. When infrared imagery was first applied to the military, civilian and research sectors of industry, typical uses were found for the new technology. Since its inception, infrared imagery has been identified as a leader in obtaining quick answers to non-intrusive testing questions. As more industries looked for non-intrusive answers to normally destructive questions, thermography was promoted even more. As more uses for thermography were found, more ways to make the IR equipment perform were found. We eventually started heating the targets to obtain more pronounced or prolonged surface views.
Individuals like Dr. Edmund G. Henneke, have detailed and pioneered such methods as vibrothermography techniques since the late 1970’s. Each specialized technique has individuals and organizations developing and making improvements to their technique. Another example of challengers in their specialized AT technique would be J. R. Lesniak and B. R. Boyce in their work associated with thermal stress analysis (TSA). The list of contributors to the advancement of AT techniques is great and includes individuals, universities and research organizations around the world.
Active thermography has a large repository of history in development and use. Much more than could adequately be covered in this paper and might well be a subject for later detail.
Changing the Viewed Target’s Surface Heat Pattern
Having made the decision that AT might provide you with the needed testing, you now might also consider the techniques for heating, cooling or stressing a target to cause heating.
In performing AT, the types of thermal stress are many and varied. Some of the more common would include the use of:
|
Simple AT
|
Complex AT
|
|
|
Complex AT
|
Acoustics
|
|
|
Air stream
|
Induction heating
|
|
|
Steam
|
Pressure
|
|
|
Current
|
Microwaves
|
|
|
Man-made light
|
Torque
|
|
|
Sunlight
|
Man-made light
|
When one or more of these stresses are applied in conjunction with the complex AT methods, we derive some of the specific techniques that are now in use or are being developed and refined.
We should note at this point that there are two basic methods of applying stresses to a target.
The first is transmissive and involves applying the stress from behind the intended viewing area. This method often is more time consuming in that viewed response is dependent upon thermal characteristics, i.e., conduction and diffusion and thickness of the target. This method also produces a saturated (heat laden/loaded area) that must be allowed to cool before areas of interest can again be viewed.
In contrast, the second method, the front surface method, will typically produce meaningful data relatively fast and may be controlled to keep from saturating the target area thermally. In this method, stress is applied at the viewed surface of a target and then removed to allow viewing with IR instruments.
It is possible to combine these methods in some forms of complex AT. An example might be the use of a stacked ultrasonic transducer located at a corner of a test specimen. The vibrations induced can be continuous and result in flaw detection throughout the test specimen. Another example might be the use of eddy current induction, from behind or the side of the specimen, to enhance possible defects.
Types Of and Techniques Employed in Complex AT
Traditionally there are two basic methods of complex AT. They are pulsed and lock-in thermography.
Pulsed thermography employs short term heating (pulses of heat) of a target and then monitoring the heat decay as observed on the surface of the target. This is generally a qualitative IR technique. In pulsed thermography, heat is measured in its transient state. Pulsed thermography provides some of the quickest meaningful data in complex AT.
Lock-in thermography employs a sinusoidal heat stress to a target and derives information like depth and type of fault by applying vectored heat signature data. In lock-in thermography, heat is measured in its steady state.
An additional method was developed in an attempt to bridge these two methods and it is called pulsed phase thermography. In this form of thermography, a short (in the order of 1 millisecond), high energy burst typically from a flash lamp, is applied to a target surface. The frequency of pulse with frequency of heating cycle is applied to fourier transforms. Additional depth, detail of fault, and type of fault may be realized using this combined technique.
There appear to be many different forms of AT techniques both already developed and in experimentation. All are generated by a specific need in a specific industry and seem to grow in use and complexity as different industries find other uses for existing techniques. With complexity, additional tools and techniques to better define a flaw or repeatable characteristic in a target are incorporated.
When approaching the selection of a complex AT technique, consider the basic block of a complex AT system, example shown below.
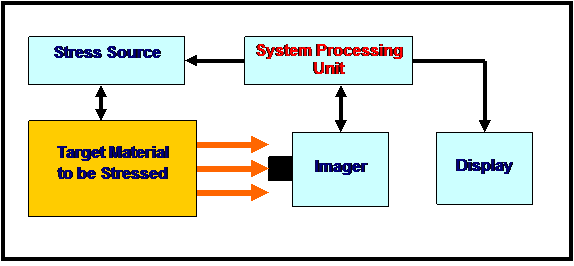
Typical Block for Lock-In or Pulsed Thermography
In the example above, the system processing unit (SPU) acts as the heart of the operation. The SPU syncs the heating source to the viewing time of the imager and records/transmits the data to a display device. The imager may be an IR spot, line imager or imaging radiometer. You may also note that the typical complex AT uses the front surface method of stressing the target.
In most cases, stress application and thermal pattern observation time, in conjunction with processing the observed data, are the parameters that dictate the method names given to the many forms of complex AT. Some of the typical methods include:
1. Vibrothermography (VT)
a. Ultrasonic Lock-In Thermography (ULT)
b. Ultrasonic Burst Phase Lock-In Thermography (UBP)
2. Thermoelastic Stress Analysis (TSA)
3. Optically Excited Lock-In Thermography (OLT)
Vibrothermography (VT)
Vibrothermography is an active IR technique that allows viewing the surface of a specimen or target and detecting problems in the surface and the bonding in layers beneath or within laminated or multi-layered products.
When a sonic wave is used to vibrate the surface of a solid or layered target, the sonics radiate outward from the source. Inclusions, determs and disbonds, and cracks will resonate at the frequencies of the induced sonics and produce heated patterns on the surface of the target. The thermoelastic effect (in metals) and the hysteresis loss effect (in polymers) become pronounced with mechanical vibration of materials at fault sites and result in resonance at the fault site.
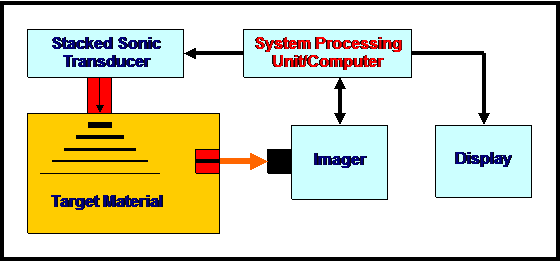
Vibrothermography Operational Block
The rate of defect heating is proportional to the frequency of the mechanical signal. This is why the signal is usually ultrasonic. At this point, the defect may be discerned as somewhere beneath the area shown by this technique. By adding low frequency modulation and phase locking to the ultrasonic signal (ULT or UBP), depth information of the possible defect may also be obtained. This is due in part to processing surface patterns as a vectored response to the sonics. When ultrasonic bursts are passed through a target, internal defects may cause parasitic (detracting or canceling) resonant waves to occur, which in turn produces a standing wave that may mask or detract from thermal patterns representing the defect. By applying frequency modulated ultrasound, these unwanted standing waves may be reduced or eliminated. This will then allow better resolution and measurement of suspected areas of concern.
Vibrothermography has current applications in wood, polymers, ceramics, and metals. It should be noted that it takes a lot of initial data via experimentation with samples, and development of methods applied to a target to produce repeatable and predictable results. Once initial constraints and methodology are obtained, repeatable results usually vary only with users of the technique and their equipment.
Thermoelastic Stress Analysis Thermography (TSA)
This is an active IR technique that allows viewing thermal variations at the surface of an object or structure by cyclic variation of a stress (pressure) applied to the object.
When pressure is applied to a metal block, the block will heat up. By applying the pressure in a sinusoidal cycle to an elastic material, clear patterns of heating are viewed by IR imagery across the surface of the material. The cyclic pressure allows a cool down period and also provides for viewing a second order harmonic, which in turn allows for validation of the first order harmonics viewed results.
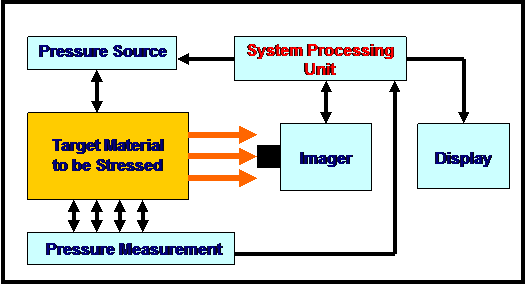
Thermoelastic Stress Analysis Operational Block
One current need for this form of active thermography is in evaluation of materials / components during fabrication and in situ usage. During manufacture of some high stress components, pre-stressing of the surface adds to the object’s ability to inhibit cracking. With manufacturing processes and usage fatigue, these pre-stressed components can weaken. This will lead to possible early damage or failure of the component. Examples of materials tested include Inconel 718 and Titanium-based alloys used in aviation engines.
TSA is another form of active thermography that uses electronic lock-in techniques to synch and coordinate the process.
Optically Heated Lock-In Thermography (OLT)
This method of AT refers to use of man-made light sources to stimulate the target. The target is heated while viewing time is coordinated with the cycle of heating stimulus. This allows viewing the target while target temperature is in an apparent steady state.
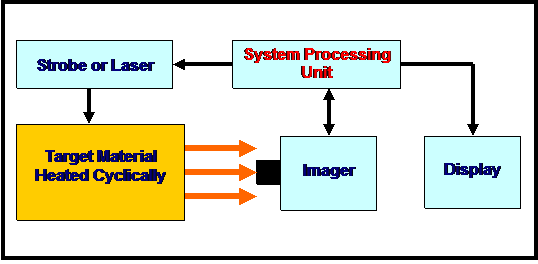
Optically Heated Lock-In Thermography Block
Having viewed some of the types of and approaches to AT you might consider how to decide which type might assist you in your testing.
Current Applications for AT
When considering typical applications for AT, it might be beneficial to separate these uses into application groups of simple or complex AT.
These groups include just a few of the many possibilities available.
Simple AT would include inspections of:
|
Composites
|
for inclusions, disbonds and voids
|
|
|
Cellulose products
|
for entrapped moisture (fungi inspection)
|
|
|
Painted surfaces
|
for subsurface corrosion
|
|
|
Bridge decks
|
for girder separations
|
Complex AT would include inspections of:
|
Ultrasonic Stressing
|
||
|
Polymers |
for cracks, separation of laminates, interaction between laminates and corrosion
|
|
| Metals | for cracks, weld flaws, deformation | |
| Ceramics | for cracks or bonding | |
| Cellulose | for separation of laminates | |
|
Optical Stressing
|
||
| Polymers | for voids, inclusions, and determ problems while possibly providing size, type and depth | |
| Pressure Stressing | ||
| Metals | for surface stress, tension or fracture | |
| Ceramics | for tension and cracking | |
One Approach for Application of an AT Technique to Your Needs
Somewhere, someone wanted to know if a separation of bridge decks from support girders (stress or corrosion causal) could be observed and possibly classed. Aircraft with newly developed composite wings were launched off aircraft carriers, leaving layers of aircraft wings behind and then landing with wings that were half their original thickness. In this case, traditional use of ultrasound to determine delamination did not work. Another industry wanted to know if corrosion and its degree could be detected under painted surfaces. Still another industry was looking for a way to detect voids in foam panels as they moved down an assembly line. The list of questions and applications for AT seems endless and is bound only by whether the question has been asked and subsequently researched.
So, you are now the one asking if AT might provide a possible solution to your need. Perhaps the following approach will help:
a. Determine what you hope to find in the target when using AT
b. Understand the expected thermal properties of the target’s surface and subsurface, considering heat transfer through the target
c. Decide on the expected minimum size of flaw or characteristics you hope to observe
d. Review the currently employed techniques of AT and decide if one or more may provide you with the data needed
e. Discuss your intended use and expectations with others currently using the decided upon technique
f. Determine equipment needs for your AT intended technique
g. Perform and record the results of your AT. Records should be such that repeatable effort and data are obtained. Baseline data will be required in most uses of complex AT for use in your application.
Conclusion
In closing, it should be noted that this paper was intended as a brief introduction to a continuously expanding field of thermography. The fastest changes in AT are occurring around its applications. That is where you come in.
Our customers continue to ask us if our imagery can be used to better their product or process. “Active Thermography” may well be a near future answer from you.
References
1. Nondestructive Testing Handbook, Volume 3, Third Edition, Infrared and Thermal Testing, ASTM © 2001, Chapter 11, “Techniques of Infrared Thermography”
2. NASA/TM 2001-210697, “Quantifying Residual Stresses by Means of Thermoelastic Stress Analysis”, Andrew L. Geyenkenyesi (Ohio Aerospace Institute, Brook Park, Ohio) and George Y. Baaklini (Glen Research Center, Cleveland, Ohio) February, 2001
3. 16th ASCE Engineering Mechanics Conference, July 16-18, 2003, University of Washington, Seattle, “A Quantitative Thermoelastic Stress Analysis for Poltruded Composites”, Rani F. El-Hajjar and Rami M. Haj-Ali
4. “Experimental Considerations in Vibrothermography”, Steven M. Shepard, Tasdique Ahmed and James R. Lota, Thermal Wave Imaging, 845 Livernois, Ferndale, MI 48220
5. “Non-Destructive Testing of Composites”, Ron Predmesky, IR/INFO 2002, Orlando, FL
6. “PHD Research Thesis: An Inverse Problem Arising in Vibro-Thermography”, Thomas Hoft, January 11, 2005
7. “Pulsed Phase Infrared Thermography”, X. Maldaque, S. Marinetti, Electrical and Computing Engineering Department, University Leval, Quebec City, P. Que., Canada G1K 7P4
8. “Common Sense Approach to Thermal Imaging”, Gerald C. Holst, Published by JCD Publishing and SPIE Optical Engineering Press, Copyright 2000
Advertisement

