Gregory R. Stockton, President
Stockton Infrared Thermographic Services, Inc.
8472 Walker Mill RoadRandleman, NC 27317 (800) 248-SCAN www.stocktoninfrared.com
[wdgpo_plusone show_count=”yes”]
Gregory R. Stockton is President of Stockton Infrared Thermographic Services, Inc. Based in Randleman, NC; the corporation operates six complete infrared systems in four divisions. He has twenty-four years experience in the construction industry, specializing in facilities construction, maintenance and energy-related technologies. Greg has been performing infrared (IR) surveys since 1989. He has published ten technical papers and numerous articles on infrared thermography in technical and trade journals.
Introduction
Think of the world as one gigantic radiator. The transfer of energy happens everywhere around us. We can see it with eyes no one else has. To the interested, inquisitive, infrared thermographer, getting paid to walk around and look at things with an IR camera is a dream come true. Those of you bitten by the IR bug know what I mean. Applications for infrared thermography seem endless.
Electrical P/PM
Checking switchgear for hot spots-no other application for infrared thermography is so well proven, documented, written and talked about, easier to sell to management, or easier to perform. It is what the majority of all infrared thermographers do for a living.
The maintenance world has come to terms with the fact that:
-
electrical resistance equals heat,
-
excess electrical resistance equals excess heat,
-
excess heat is bad (because it indicates a potential failure),
-
excess heat can be seen with an infrared camera,
-
a useful IR report of a problem can be generated so that repairs can be accomplished on an electrical component prior to failure.
It has been extremely well documented that annual and/or semi-annual IR inspections produce a large return on a small investment. The insurance industry has discovered this fact and of late is promoting, recommending, and in some cases requiring that the insured perform infrared surveys on a regular basis.
Mechanical P/PM
For every piece of electrical component, there are five mechanical components that can be checked using IR. Instead of resistance, heat is promulgated by friction. Just as electrical resistance equals heat, mechanical friction equals heat. However, IR/PM on mechanical equipment is more difficult to perform, since there are so many more variables with mechanical equipment producing friction than with electrical switchgear producing resistance.
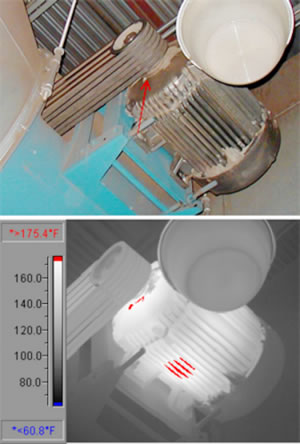
For example, let’s look at electric motors. Electric motors are probably a maintenance engineer’s biggest headache, since they have lots of breakable parts such as electrical connections and windings, they operate at variable speeds and loads, and they drive many different pieces of equipment. Often the rewind shop neglects to change the nameplate ratings, such as a change in insulation class. The environment surrounding electric motors also changes with respect to dirt, dust and ambient temperature. My experience has also been that the manufacturers either do not know, are not willing to share, or do not want to assume liability for in situ temperature data on their products. True, all the above factors make it difficult to know how hot is too hot on an electric motor, unless temperatures have been trended over time and all variables considered. Most mechanical components do heat up due to friction, so comparison of time vs. temperature or direct comparison to like-loaded components works best. There are many mechanical components in the industrial setting waiting to be scanned.
Infrared predictive maintenance (IR/PM) has become a regular part of the maintenance of industrial electrical and mechanical equipment. Damage to the equipment itself has never been the real issue. The main motivation for IR/PM programs is reducing downtime that equipment failures cause.
Electrical and mechanical IR/PM are the undisputed “low-hanging fruit” of infrared thermography.


Process Improvement
The fact is that infrared process improvement has many times the potential payback of any IR/PM program. Savings from downtime reduction and equipment costs are minuscule when compared to savings from making a machine run even 10% faster with 10% less waste, 24/7. It does not take a math whiz to understand that if you can fix a problem at the beginning of the manufacturing process, you will eliminate waste, eliminate returns and promote customer goodwill. Infrared surveys are very inexpensive when compared to throwing away products that you sent all the way to the end of the line before discovering a flaw…or worse, sent a defective product to your valued customer only to have it returned at your expense.
Even if it is not possible to look inside a machine, the effects of the machine on the product can almost always be seen using IR. The key to process improvement infrared is to get the machine designers, operators, and industrial engineers involved in the process. They usually know all about the machine and the process. They just need to “see” in the infrared.
Infrared on-line monitoring equipment for manufacturing lines has a great potential, although sales of this equipment have not yet met IR equipment manufacturers’ expectations. Surely sales of this type of equipment will improve as detectors and software improve and as product manufactures seek more efficient ways to producing goods in a more competitive marketplace.
Non-Destructive Testing
In general, there are two ways to get information about what is going on inside any object(s). Simply:
-
Don’t do anything. Watch the object radiate heat.
-
Create the conditions needed. Either;
-
Apply heat to the object and monitor the results, or,
-
Apply heat to the object and monitor what happens when then object cools (this works with applying cold also), or,
-
Put a heat source behind the object and watch what happens when the heat comes through it.
-
There are variations on these. What a great application for IR.
Research & Development
If successful, many R&D applications are literally worth millions of dollars. Only a small percentage of these techniques and applications are published in forums such as IR/INFO, because they are tightly held and legally protected secrets. Often it is not as simple looking at something and seeing a defect. Instead, these techniques have been developed over the course of years and refined by scientific scrutiny at a cost of hundreds of thousands of dollars.
Facilities
Building Heat Loss
Inspecting buildings for heat loss was one of the first commercial uses for infrared thermography. As countries decide to become less dependent on fossil fuels, IR will again be used as it was in the 1980’s in order to monitor the energy efficiency of buildings. In very cold climates, poorly installed insulation and vapor barriers can lead to condensation problems and the degradation of the building itself. As more “fresh” outside air is introduced into buildings, condensation and its side effects, mold and mildew, are a real threat (especially in the form of health-related lawsuits) to the building owner/operator.
Building Quality Control
Infrared thermography can be used as a building quality assurance tool. Almost all building materials will retain heat energy and therefore can be checked for quality of installation. Improper installation of insulation and/or seals in buildings can be seen in the form of heat loss and air leaks. Also, building components “inside” the walls, ceilings and floors are recognizable because of their differences in mass. For example, infrared thermography can be used to determine the presence and correct placement of grouted cells in concrete block walls. If the owner of a new block building spends a little money checking their (the low-bidder’s) work with infrared thermography, the contractor will be forced to build the building per specifications or face the added direct cost of repairs and resulting loss of schedule repercussions.
Roof Moisture Surveys
A well prepared, graphic and accurate map of the infrared signatures of a roof can be of tremendous benefit to a building roof owner at all stages of the roof’s limited life. Knowing where the subsurface moisture is located will help the roof owner manage his assets. This form of predictive maintenance works well on many types of flat and low-slope roofs. Here are the basics: At night, areas of roof moisture are warmer, because the accumulated heat (from daylight sunshine) in the trapped water mass is greater than in the dry, functioning insulation or roof substrate. After sunset, as the roof’s structure cools down, the wet areas of roof insulation and other materials maintain higher temperatures because of their higher mass, allowing infrared cameras to detect the sources of heat and record them for later analysis.
There are two ways to perform IR roof moisture surveys: on-roof and aerial. I first performed an on-roof infrared survey as part of an overall building survey in 1989. I do not like performing these surveys from the roof…here’s why. When standing on the roof, eye-level is at best six feet over the surface. If you are looking out over a roof with large areas of moisture contamination (even if you have a good camera) there is virtually no way, without taking multiple shots, that you can get, say, a 900-square foot amoeba-shaped blob, or an 80-foot long striation of subsurface moisture resolved on the screen in one infrared shot. If you take multiple shots, the report becomes confusing, and the visual images that you have to take the next day are hard to line up with the infrared images. J. P. “Sonny” Ledoux, an infrared thermographer with over twenty years of infrared experience, describes the problem best in saying “When performing on-roof surveys, many times, you can’t see the forest for the trees.” It is difficult to schedule, perform, document and produce high quality reports. One can easily be fooled by heat due to other factors such as water between multiple layers, old patches, heavy flood coats, reflective coatings, heat-producing equipment under the roof, heat blowing down onto the roof surface, stains on the roof, heavy build-up of ballast at parapet walls and along edges, etc. The best way to obtain excellent imagery is to get high above the roof and look down. This helps avoid reflections and one gets a larger area in the picture.
We tried using helicopters. Ferry times were slow, costs were high, and we had to deal with vibrations. We have found that by using fixed-wing aircraft together with high spatial resolution (512 x 512 focal plane array cameras with 262,144 pixels) infrared cameras, we now have the right platform. The disadvantage is that small roofs, far away from the plane’s operational area, become cost-prohibitive.
There are numerous advantages to performing the infrared roof moisture surveys this way:
-
Costs are comparatively low per square foot because we fly millions of square feet per flight, with a crew of two. We can wait for the right night for imaging, and survey many roofs under good conditions.
-
Aerial imagery is better than on-roof imagery, but not because we have four times the pixels. We use up our pixels by flying typically 1,500-2,000 feet above the building. The reason is that by getting a large area of the roof in one view, we have more useful imagery. One can see the beginning and end of a long striation or large amoeba-shaped blob of heat on the roof. This allows us to see lesser and more water, by mass, because we are not standing on top of it.
-
High-angle, straight down infrared images lessen reflections, eliminate the problem of rooftop equipment being in the way of the image and eliminate the problem of access to multiple levels of the roof.
-
Plan view imaging allows for the accurate marking of areas of suspect roof moisture contamination onto AutoCAD drawings. The drawings are made by laying the blank AutoCAD “over” the captured visual and/or infrared image on the screen. If dimensional information is available, this creates a quantitative, scale-quality AutoCAD drawing of the suspect moisture contamination on the roof.
-
By capturing large areas at once, a high quality report is easier and less expensive to produce. Infrared thermographs, visual photographs and AutoCAD drawings can be made of the roof. As a result, the report is clear, concise and easy to understand. The report can also be purchased as needed, with respect to level of detail. Here are the different levels of reporting, in order of costs: a) unedited videotape, b) edited videotape, c) printed thermographs, d) aerial photographs, e) AutoCAD drawings, f) digital and printed report. The buyer of this service has the advantage of obtaining any one or all of these report components, with the cost being proportional to the level purchased. Also, since the digital videotape (a record of the roof on that night) is archived, he/she can use this information later, to compare proportional images of that same roof to images from a later date.
Perhaps the biggest advantage of aerial infrared is not its use on roofs that have well-defined areas of moisture at all, but those roofs that are the most difficult to image from any distance or angle. I am referring to the roofs that, for instance, have a lot of ballast, are covered with reflective coatings or ones that for whatever reason are impossible to image from the roof. With high-resolution aerial imagery, slight nuances of temperature can be seen from far enough away to actually see the pattern of heat.
Aerial Infrared Applications
When a liquid is introduced into a body of water (ocean, river, stream, lake) the former can be differentiated through the use of high-resolution thermal imaging because the temperatures are almost always different. Often these liquids can be followed back to their source. These environmental impact infrared surveys can be used to detect illegal dumping and/or discharge, track pollution such as waste spills or oil spills, monitor effluents from storm drains and sewage treatment plant discharge, monitor ground water seepage into rivers, streams and lakes, manage heated water from power plant cooling towers, or measure the amount of fresh water from ground sources that is introduced into an estuary.
Many warm-blooded animals can be found and counted from the air. It is far more accurate than any other method and is used primarily by government agencies. Animal counts, such as deer population density information, is used to monitor and control the population of deer on city, county, state and federal lands.
When a road or building complex is planned, the site can be flown to see if any geothermal activity is present at the surface. The U.S. Forest Service uses aerial infrared imaging to monitor forest fires. This information can be sent immediately to those in charge of controlling fire lines. Subsurface fires can also be monitored using aerial infrared thermography. Landfill fires can be hazardous to the surrounding environment. Knowing where, how many and the extent of underground fires is useful to those in charge of containing and/or extinguishing them. Peat, coal and wood chip piles, which combust spontaneously, can also be monitored. Aerial infrared can be helpful to the firefighters of structural fires, especially on large, single story buildings. Where ancient Indian trails cross the desert, the land under the trails has been compacted. By using nighttime aerial infrared imaging, the aerial infrared thermographer can see this higher density differentiated from the lower density adjacent to the trails.
Even from high altitudes, steam line inspections are one of the easiest applications for aerial infrared thermographers. Thermal contrast between active steam lines and the surrounding ground are usually good. High voltage electrical transmission lines can be imaged from the air. Even from shorter distances, accurate temperatures of electrical faults are almost impossible to measure due to the spot size to target distance ratio problem. Detecting electrical faults is much easier and can be accomplished. Specification writers have not yet realized the simple physics of this problem and continue to ask that quotations include providing quantitative data on fault areas. Because they are smaller, lower to the ground and run through populated areas, high voltage electrical distribution lines are much more difficult to see against all the thermal clutter on the ground such as trees, street lights, people, animals, etc. They are best left to ground-based thermographers. Pipelines are also difficult to survey. Trees, shrubs, brush and water often cover the pipeline.
Search and rescue (SAR) operations are often “rush” jobs where conditions are less than ideal. Aerial infrared SAR is better than ground-based SAR in most instances; however, it is still overrated. People targets either do not want to be seen, are disabled and unable to move to an area where they can be seen, or are trying to keep the warmth of their body close by insulating themselves, so they cannot be seen.
Applications: Everywhere
So far, I have discussed electrical and mechanical predictive maintenance, process improvements, R&D, NDT, facilities and miscellaneous aerial infrared applications. There are many more that do not fall directly into a particular category.
Some include:
-
Weather prediction
-
Veterinary medicine
-
Human biomedical
-
Circuit board testing
-
Security/law enforcement
-
Night vision
-
Land mine detection
-
Smokestacks/refractory
-
Steam and hot water boilers
-
Glass manufacturing
-
Industry-specific applications, i.e., auto, steel, etc., manufacturing
And there are many more. The point of this paper is that there are too many to list…
Conclusions
The infrared thermographer who performs only one or two types of surveys is missing out on many rewarding applications. Do you ever notice how you loathe writing the reports? The reason is that you have already done the fun part-that is, the discovery. It is great fun to discover, no fun to disseminate information to others. It is our industry’s challenge to explore new markets, improve our methodology for gathering and disseminating infrared data and find new ways to use this fantastic technology.
Those who challenge themselves to explore new markets, develop new techniques and improve the body of infrared knowledge will reap the financial and intellectual rewards. With modern infrared cameras, software and computers, infrared thermographers today are almost never limited by the infrared equipment’s ability to measure temperatures or discern differences in temperature. Rather, we are only limited by our imagination.
Fig. 1-Loose lug connection on electrical circuit breaker |
|
Fig. 2-Mechanical blower motor profile |
|
Fig. 3-In situ electric motor IR testing |
Fig. 3b-Electric motor trending spreadsheet |
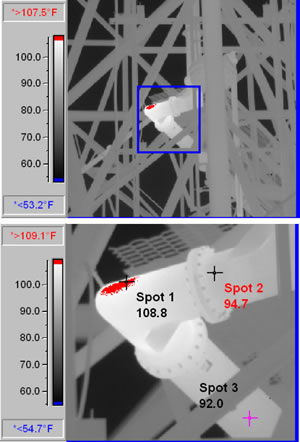
Fig. 4-Television transmission tower elbow complex |
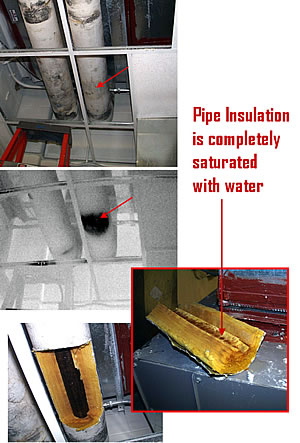
Fig. 5-Wet insulation on cooling pipe system in building |
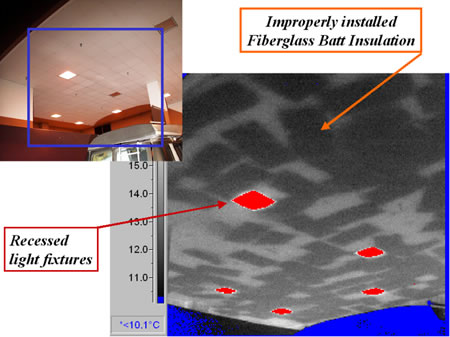
Fig. 6-Improperly placed fiberglass batt insulation in building |
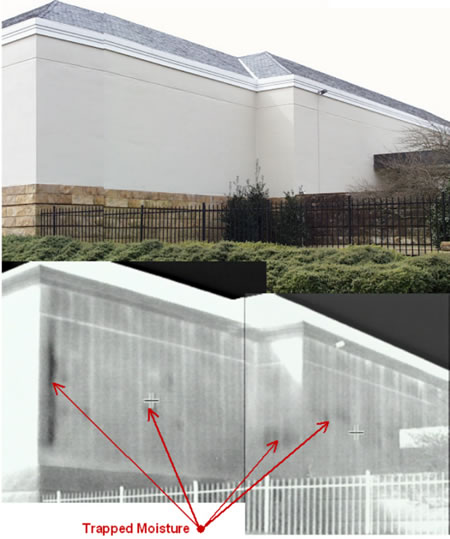
Fig. 7-Moisture ingress in stucco building walls |
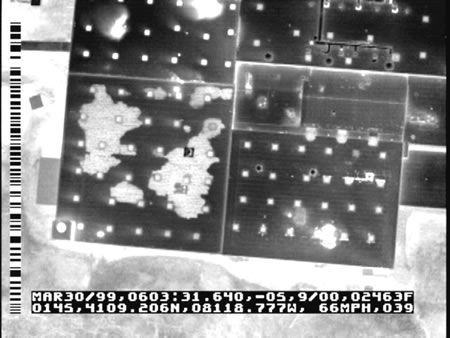
Fig. 8-Aerial infrared image of flat roof from about one half mile away |
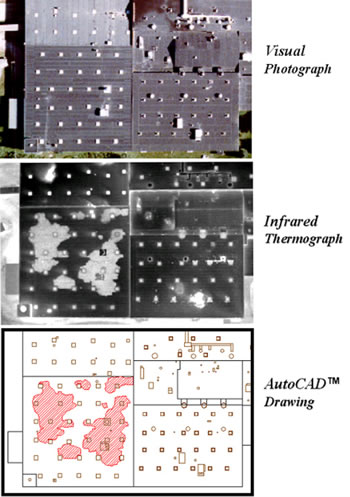
Fig. 8b-Components of an aerial roof moisture survey |
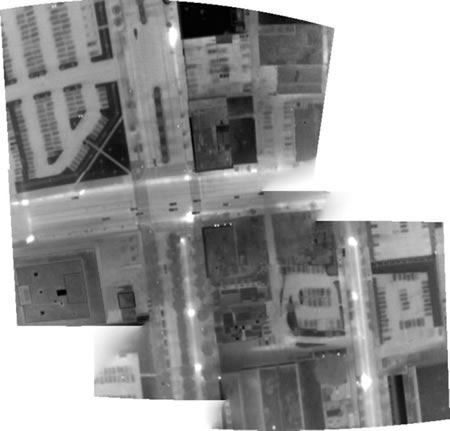
Fig. 9-Composite image of aerial infrared survey of underground steam system |